
This post explains what skew is and gives 2 examples of how to trade it.
If you understand skew it will help you understand why options are being priced the way they are.
It opens many doors for trading opportunities.
Skew is used to infer the implied distribution of the stock in the future. One thing to remember is that options are based on the future distribution of a stock.
Before we jump into it.. we first we need to understand some of the basics.
Take a look at the Graph below.
It is a chart that shows how often different returns happen for a stock. What do we notice about it?
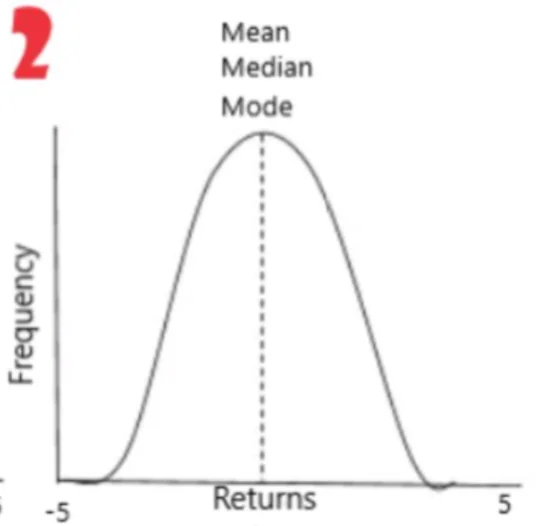
X axis is daily returns for a stock. Y axis is how frequently that daily return occurs.
We can see that the most frequent return is 0%, and the likelihood of a big move up or down is even (same frequency of a 5% up move vs a 5% down move). We call this a "normal distribution".
If we looked at a stocks returns over the last year and saw that it was normally distributed, what conclusions could we draw? Well, we could say that :
- Most of the time the stock will move about 0%
- There is an equal chance of a large up move and a large down move
Easy right? But here's the thing..
Stock returns do not typically look like this.
You ever hear the saying: "Stocks go up like an escalator, and down like an elevator*?*"
I'm sure most of us have heard that one before. What is this telling us? It tells us that stocks tend to go up slowly, and then crash down quickly.
OR...
Most of the time, we see a small move up in stocks. Occasionally, we see a large move down.
Because of this, the distribution of a stocks returns aren't typically normally distributed. The look more like this.
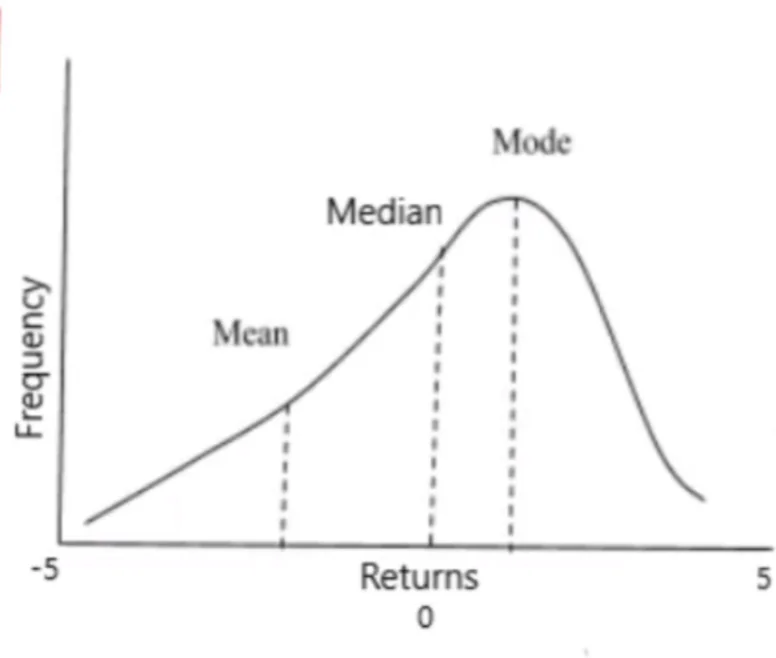
X axis is daily returns for a stock. Y axis is how frequently that daily return occurs.
We can see on the graph above that most of the time we have frequent small up moves, and infrequent large down moves. The top of the line is slightly to the right of 0, and the left side of the graph is a bit more elevated than the right side.
Since this is how a typical stocks returns look, what conclusions can we draw?
- The most frequent daily return for a stock is a small up move.
- Big down moves happen with more frequency than a big up move.
As we can see, the distribution is skewed.
A skew in a distribution is when one of the tails is longer than the other. If we look at graph above we can see that the tail on the left is skewed. This is known as a negative skew since it has a long tail in the negative direction.
If the big positive moves had more frequency than the big negative moves, we would call it a positive skew.
An interesting question..
Given this is the typical distribution for a stock returns, and knowing that options are used to make a bet on the future volatility of a stock, how would we expect options to be priced, puts vs calls?
(Remember, options try to price the future distribution for a stocks returns).
An even more interesting answer..
We would expect to see puts more expensive than the calls on equities because the risk is to the downside*.*
Let's break this down.
Skew is the difference in implied volatilities between the out of the money puts relative to the out of the money calls. It shows us where the demand/supply is located on the chain.
For example:
On a $90 stock you might see something like the $100 call is trading at 40% but the $80 put is trading 60%.
What this is telling us is that the put options are more expensive than the call options.
Most people who are long equity look to hedge their exposure to a crash by buying puts, so you would typically see high demand for puts with relatively low supply.
This makes sense right? Let's think about the S&P500 options for a second.
The whole world is basically long equity. So where do they go to hedge? Typically Pension funds and the like will be buying puts or writing calls on something like the S&P500. This creates huge demand on the put side, and lots of supply on the call side.
The odds are we have small moves upwards, but if there’s going to be a blowout, it will likely be to the downside. Protection, or exposure to that, costs money!
This difference in price for calls and puts is what we call skew.
Looking at the skew tells us 2 main things
- What direction the market thinks the most likely move is
- What direction the market thinks the big move risk is
The key word here is that skew tells us the market implied likelihood of different moves.
This is important to note because the way we make big bucks as traders is by identifying areas we disagree with the market and trading them accordingly.
It is important to understand what the market thinks is going to happen so you can compare that with your view on the market.
Let's pull up the skew for SPY so we can see what it actually looks like.
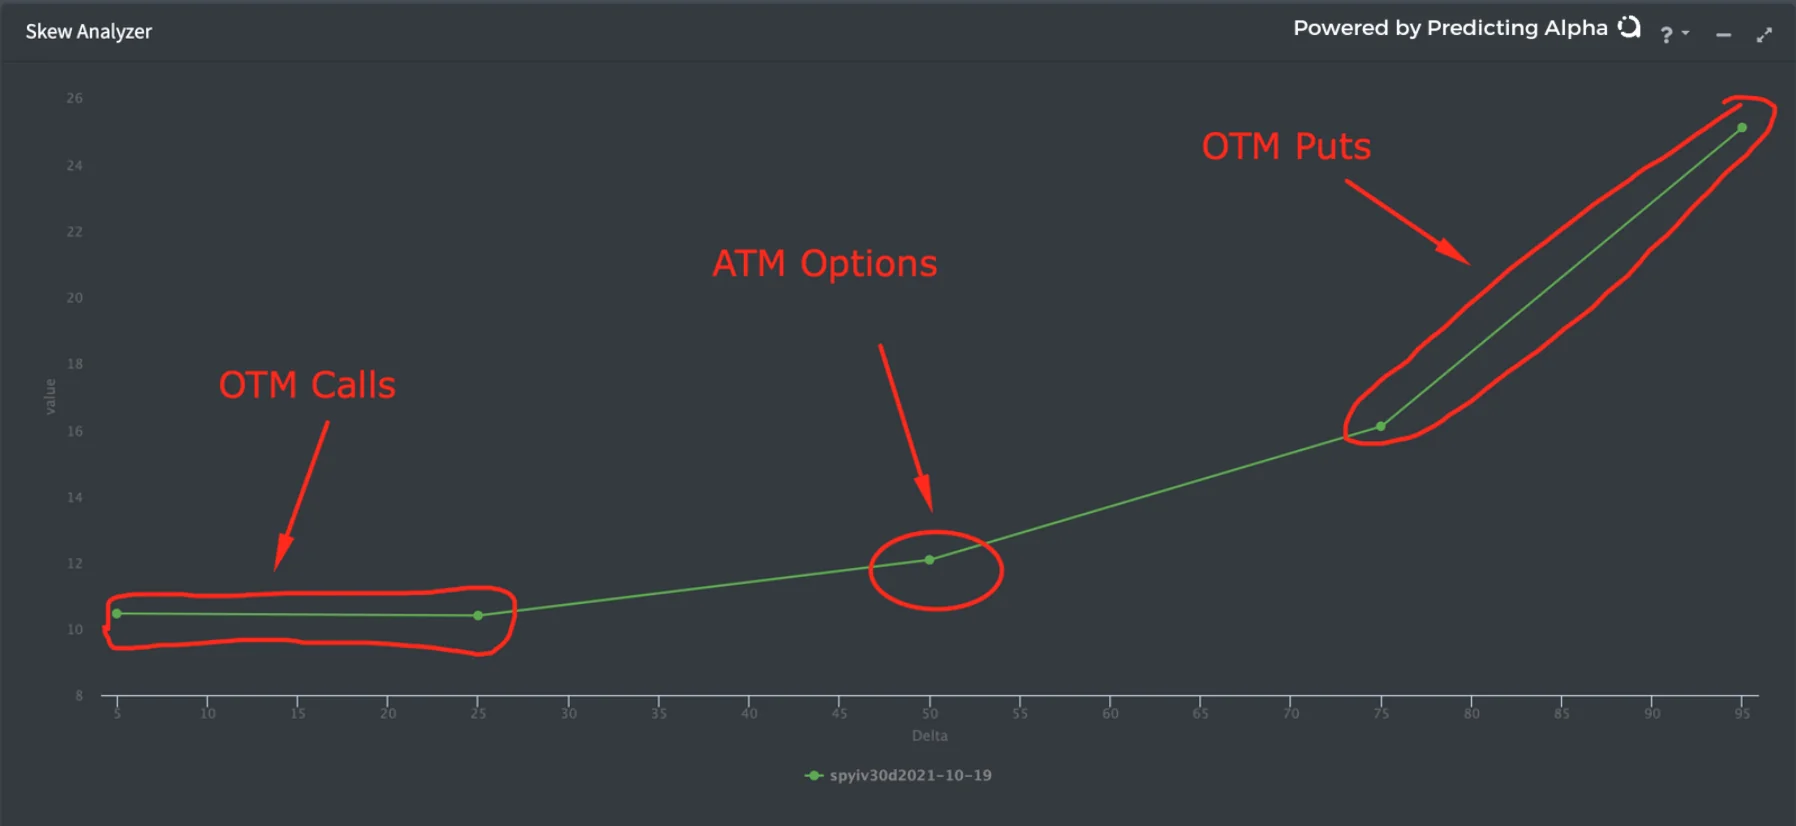
Skew for SPY 19/10/2021
Basically, on the X axis we have the call deltas, and on the Y axis we have implied volatility.
or in simpler terms
The left side is OTM Calls, the middle is ATM calls/puts, the right side is OTM Puts.
note: Some softwares will plot it the other way around.
By visualizing this, we can quickly see how the different portions of the option chain are priced relative to each other.
As we can see, the OTM Puts are higher than the OTM Calls. This is what we would refer to as "put skew".
This is what we would typically see for a stock.
Once again, this is because they typically make small frequent moves to the upside, and then large infrequent moves to the downside.
Does a stock's skew always look like this?
The market is alive, so things change.
- Market conditions change
- Stocks have big news releases
- Insiders know about a buyout before it happens
- WSB tries to squeeze a stock
- A big court case is about to get settled
- A new drug is awaiting approval for a pharmaceutical company
Depending on how different variables in the market change, the skew changes to reflect what the market expects to happen in the future.
If a stock gets squeezed and jumps up 100%, what is the skew most likely to look like?
We can take a guess by answering the following two questions:
- What is the most likely move in the future?
- Where is the risk in the future?
In the case of these meme stocks that get squeezed, the most likely thing to happen is that it moves down a bit. The risk is that it keeps moving up by a huge amount. So the skew might look something like this:
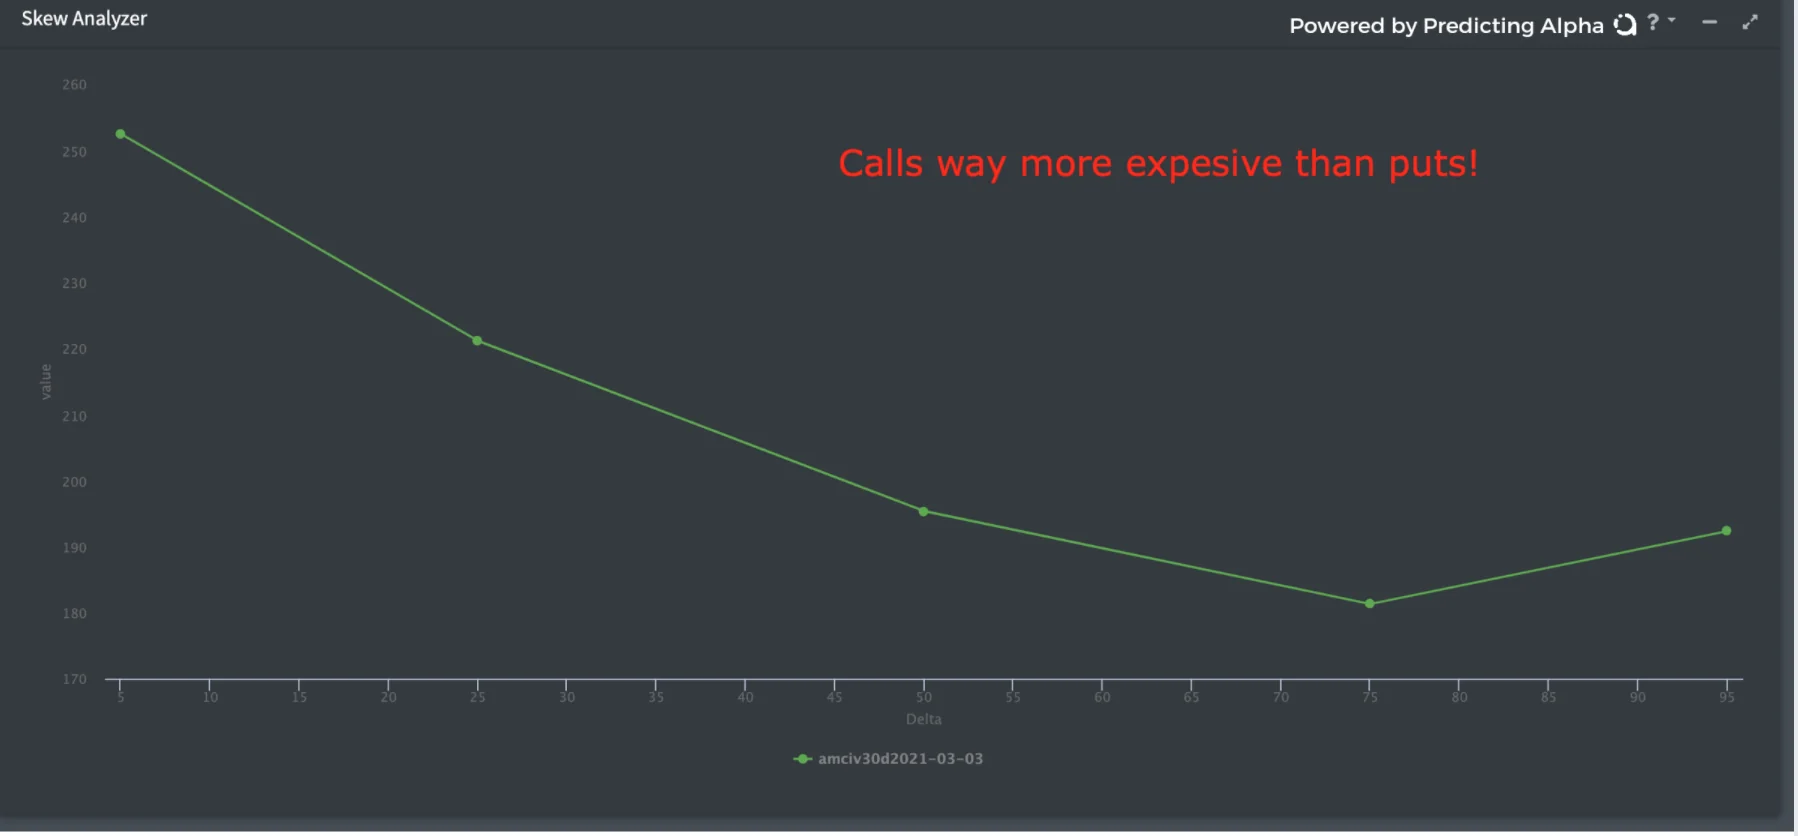
AMC 30DTE Skew 03/03/2021
As you can see, on AMC, the skew was heavily to the call side! But is it always like this?
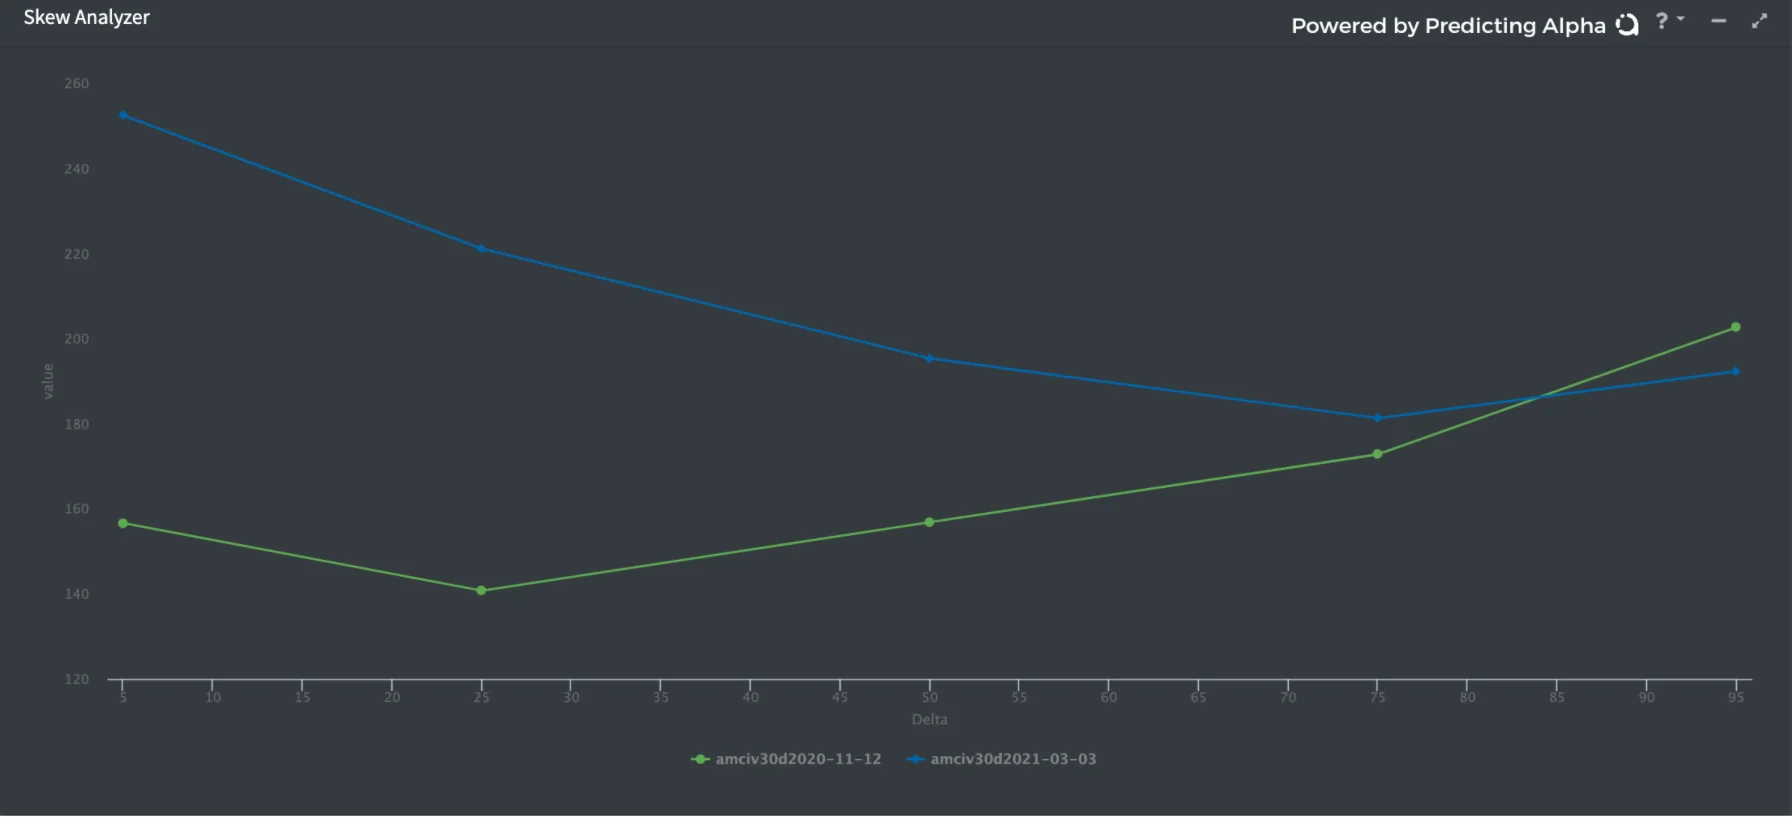
Green line is AMC 30dte skew in November 2020. Blue line is AMC 30dte Skew in March 2021
Here is a prime example of the skew changing! Before the whole meme stock craze, AMC had a lot of put skew. This makes sense, because the risk was that the stock would go down a lot.
But after it started squeezing, things changed. The risk was now that it moons! So the options market changed to reflect this.
The OTM Calls went from being cheaper than the OTM puts, to being more expensive!
Over time, the skew changes to reflect the market's view of what could happen to a stock between now and the expiration you are looking at.
Yep, each expiration has it's own skew. This is because we are looking across the strikes, and every expiration has its own strikes! I know, it can be a bit confusing.. but once you wrap your head around the concept of skew you will be able to understand the market a whole lot better.
How can we take advantage of the skew?
There are so many different ways to trade the skew. Risk reversals, spreads, selling or buying options..
In short, we can trade the skew when we disagree with it.
Here are 2 example of how we can trade the skew (there are more, but here's two):
1) We can trade a change in the skew
Here is a time series of the 30 day skew for TSLA:
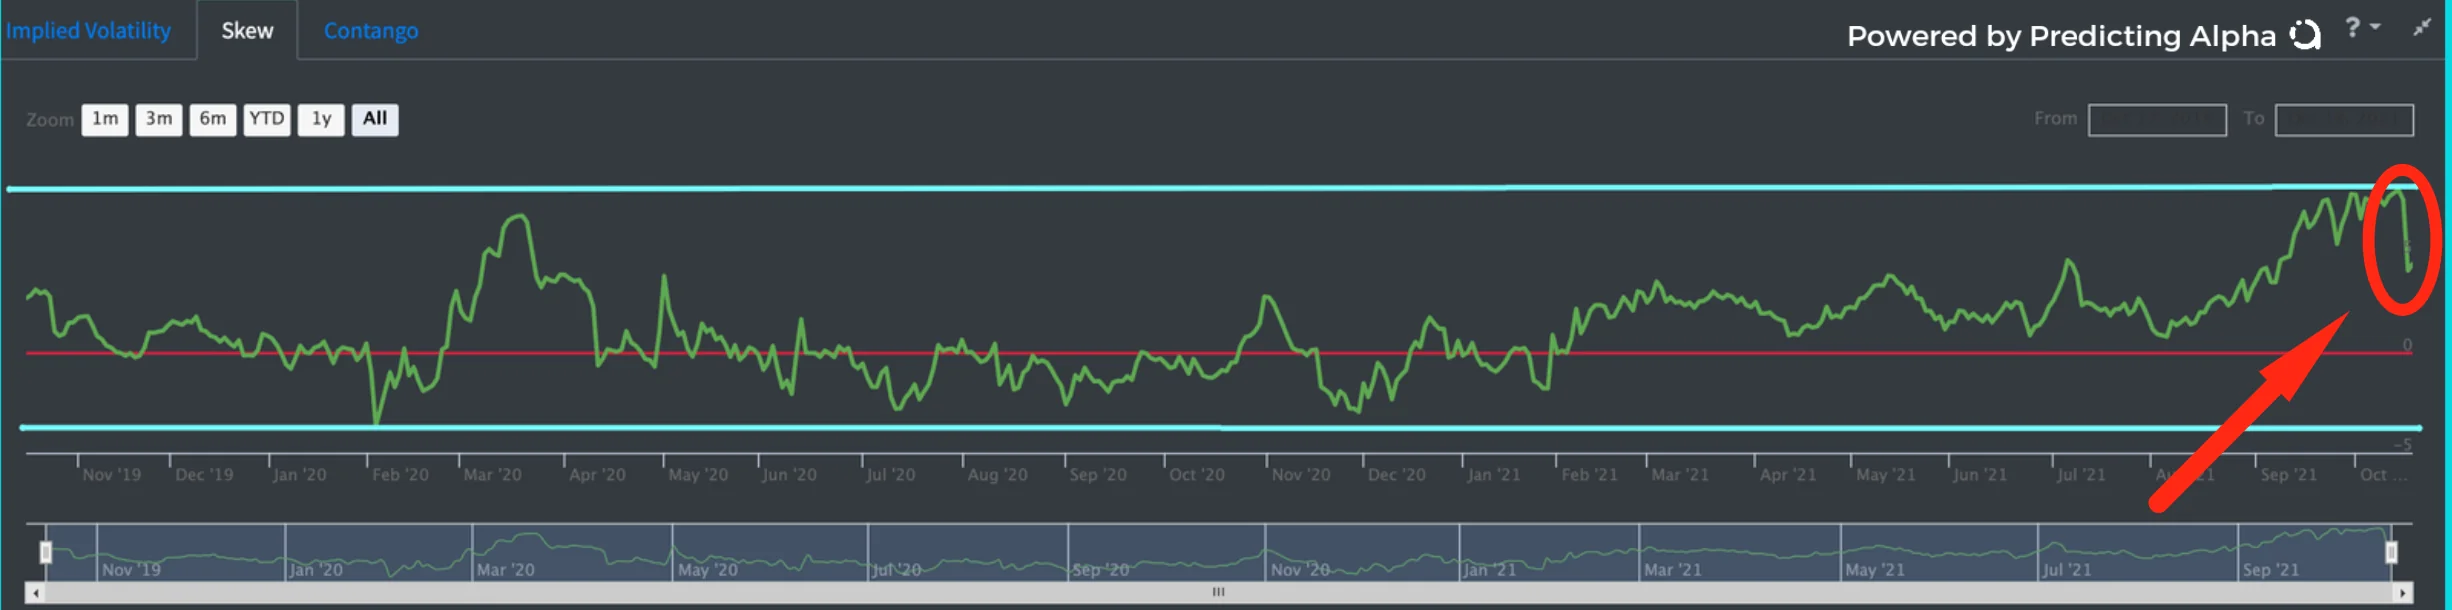
TSLA 30dte skew over last 30 days. the higher the number, the more put skew. The lower the number, the more call skew. 0 would be flat skew.
What can we see? We can see that TSLA put skew got REALLY steep last week. The highest it's been in 2 years. We could have taken a trade here that bet on it coming back down to a more typical level.
The optimal trade here would have been a risk reversal, since it would have made money on the skew coming back down AND on the positive deltas!
How to find trades like this:
The first thing you will want to do is scan for stocks that have elevated skew. You can use filters like Skew Rank (It's like IV rank, but for skew) or just "Skew".
Then I will look at the skew time series (like the picture above) and use that to help me gauge what the change has been relative to what we see in the past.
From there, I will look at the skew for different expirations to see where it is most out of line.
Once you have found a stock where the skew has changed drastically (to the upside or the downside), the second thing you do is ask yourself the question: why is it happening?
If we can understand why, we can then determine the rationality behind it. Are people overly hyped about something? Is there too much fear right now?
If we think the market is overreacting to something (or under reacting), we can put on a trade like this!
2) We can take advantage of the skew to get a high R:R trade
Something I like to do is trade unbalanced flys into steep call skew. It's basically the best lotto tickets you can get in the market.
Check this out:
I did a scan today for stocks with expensive call skew. COIN came up on my radar.
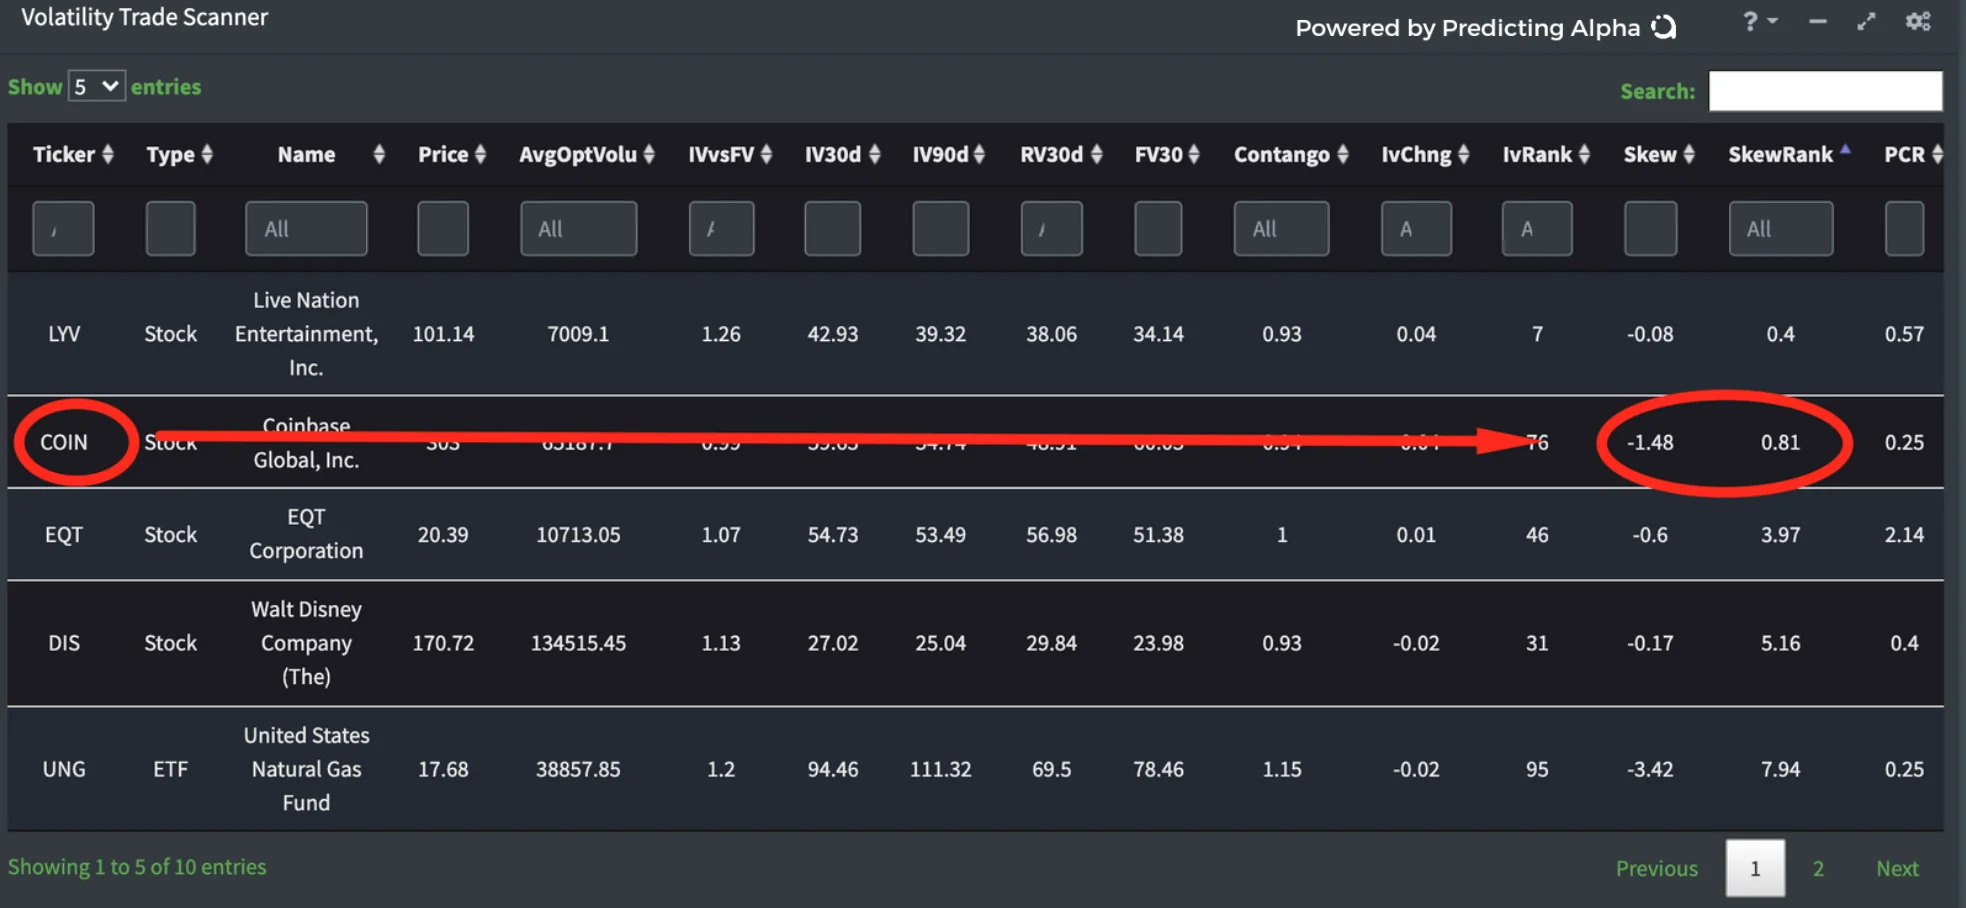
Here's what I saw:
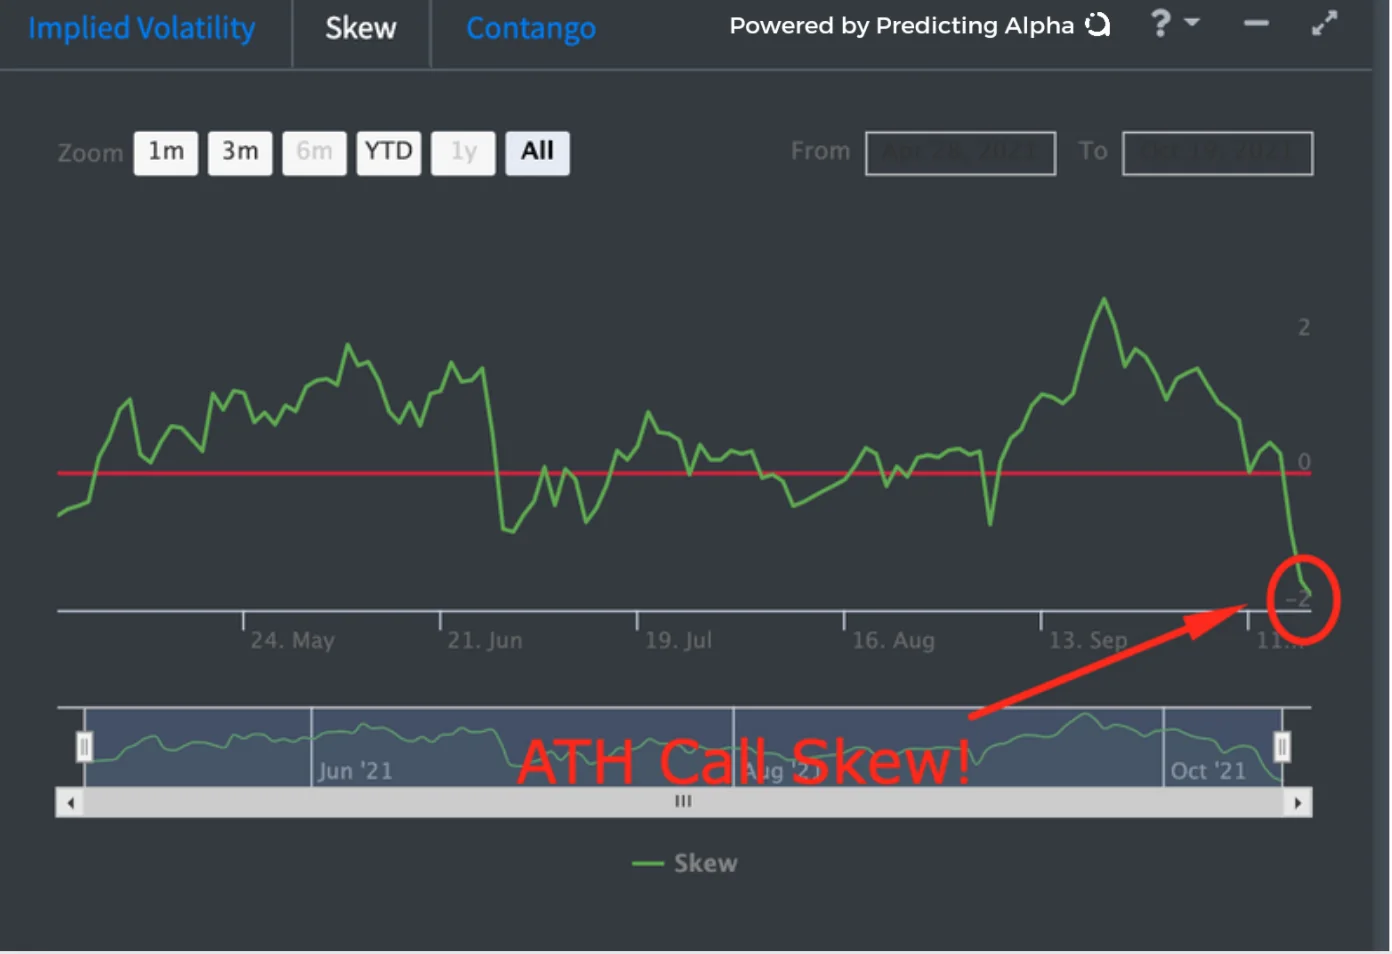
Relative to historic skew, it is now the most skewed to the call side that it has ever been!
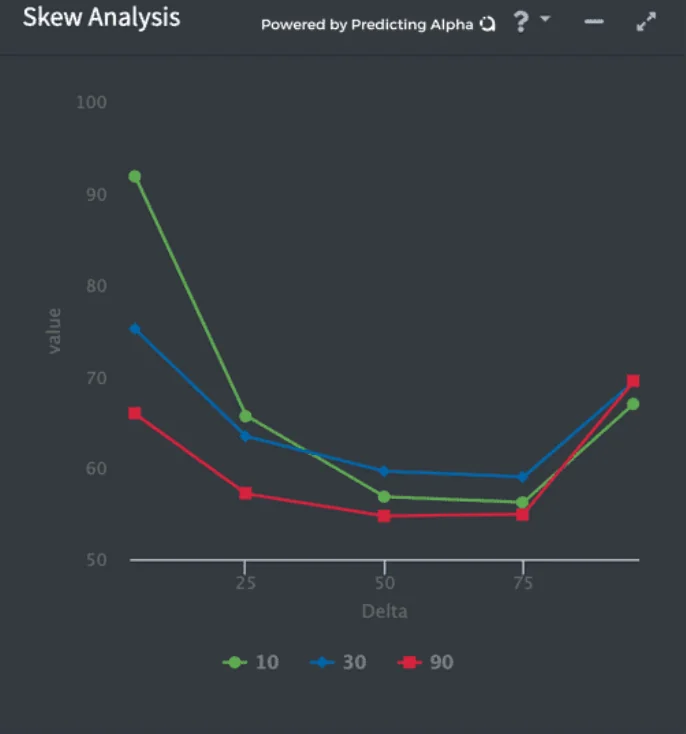
Looking at a few different expirations, it seems the skew is steepest in the near dated options (green line).
COIN skew is at the highest call skew it has seen!
This is pretty crazy, the market is pricing in a lot of risk to the upside here.
Now let's say I am bullish on COIN. I think it will rally another 5% in the coming week.
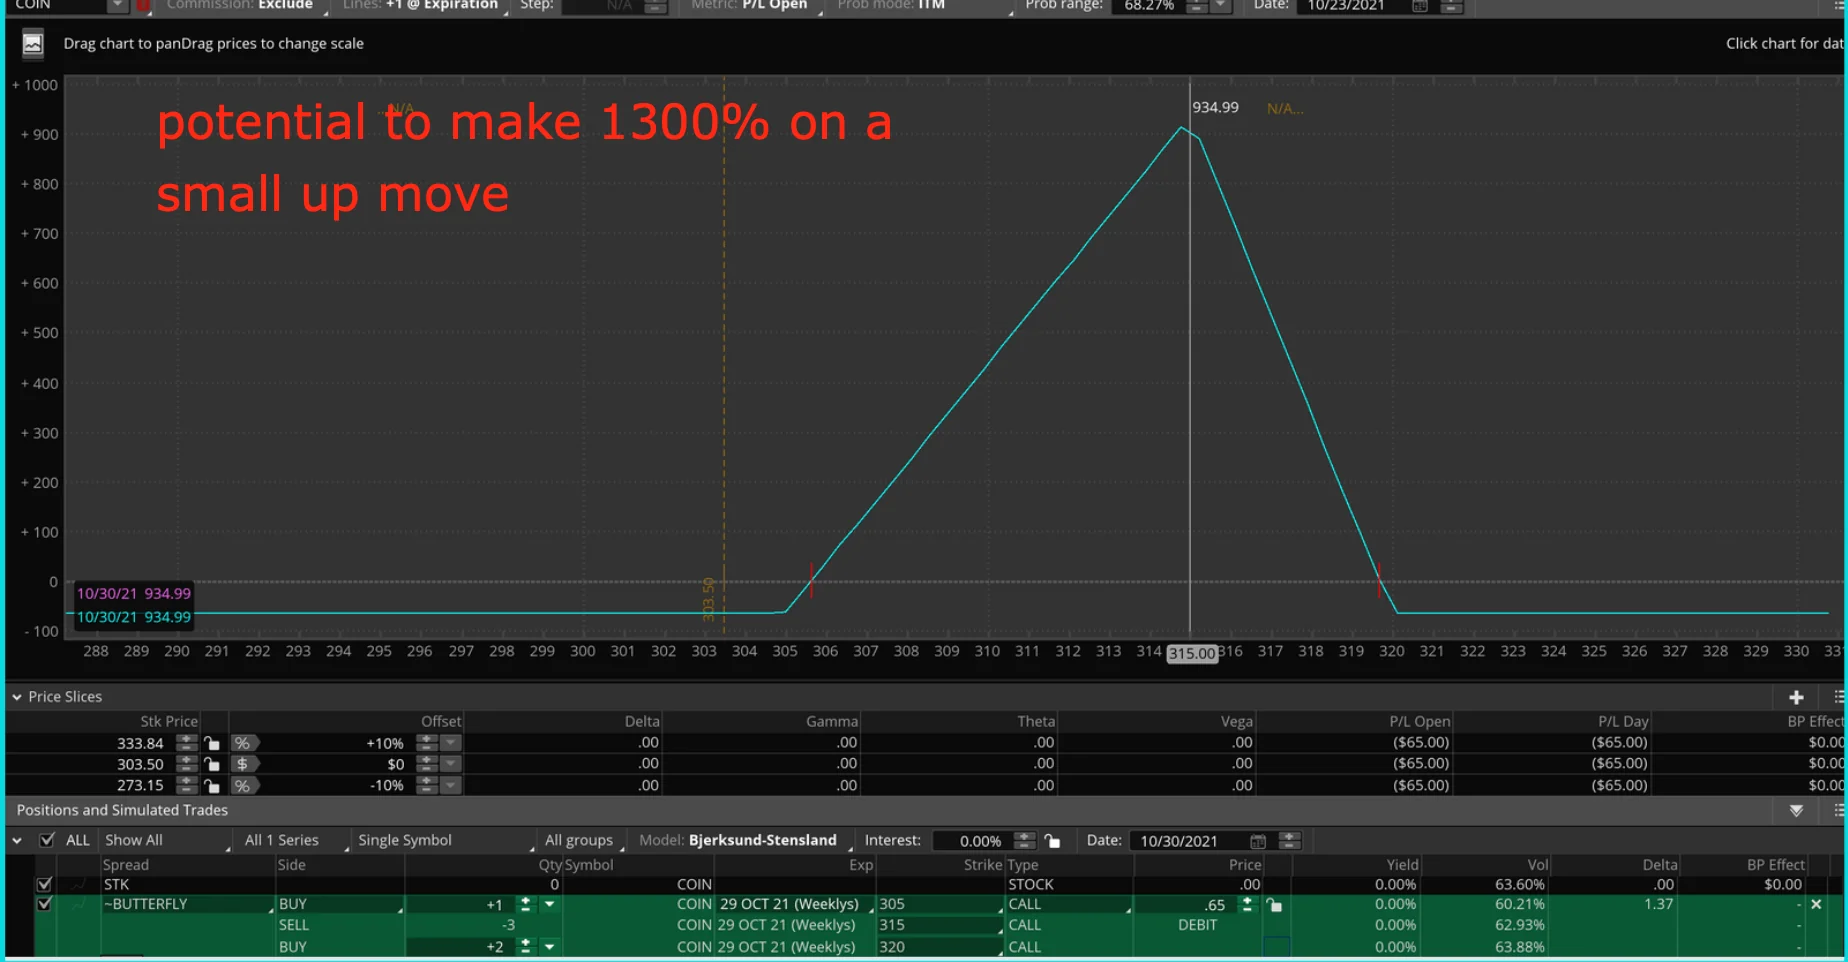
What we did here was trade a 1-3-2 fly into the call skew.
We are paying $65 per fly, with a max payout of $935 each!
We bought a call at-the-money, and financed it by selling 3 out-the-money calls! We then went even further out and bought 2 as a hedge, giving us this nice risk defined trade.
These are my favourite little YOLOs. Low risk, super high reward.
I like to do them around earnings especially, and sometimes you can find wild trades like this one!
Conclusion
Skew just shows us the balance in supply/demand for calls and puts. Are people more hungry for calls? Or more hungry for puts?
When we can understand this, a lot of doors open. But remember this: Knowing skew isn't an edge. It's just a feature of the options market that we need to understand if we want to be able to understand what we are seeing and create better ideas of our own.